version 6.25.10 OS linux install via conda (channel: bioconda)
What I did (reproduction steps):
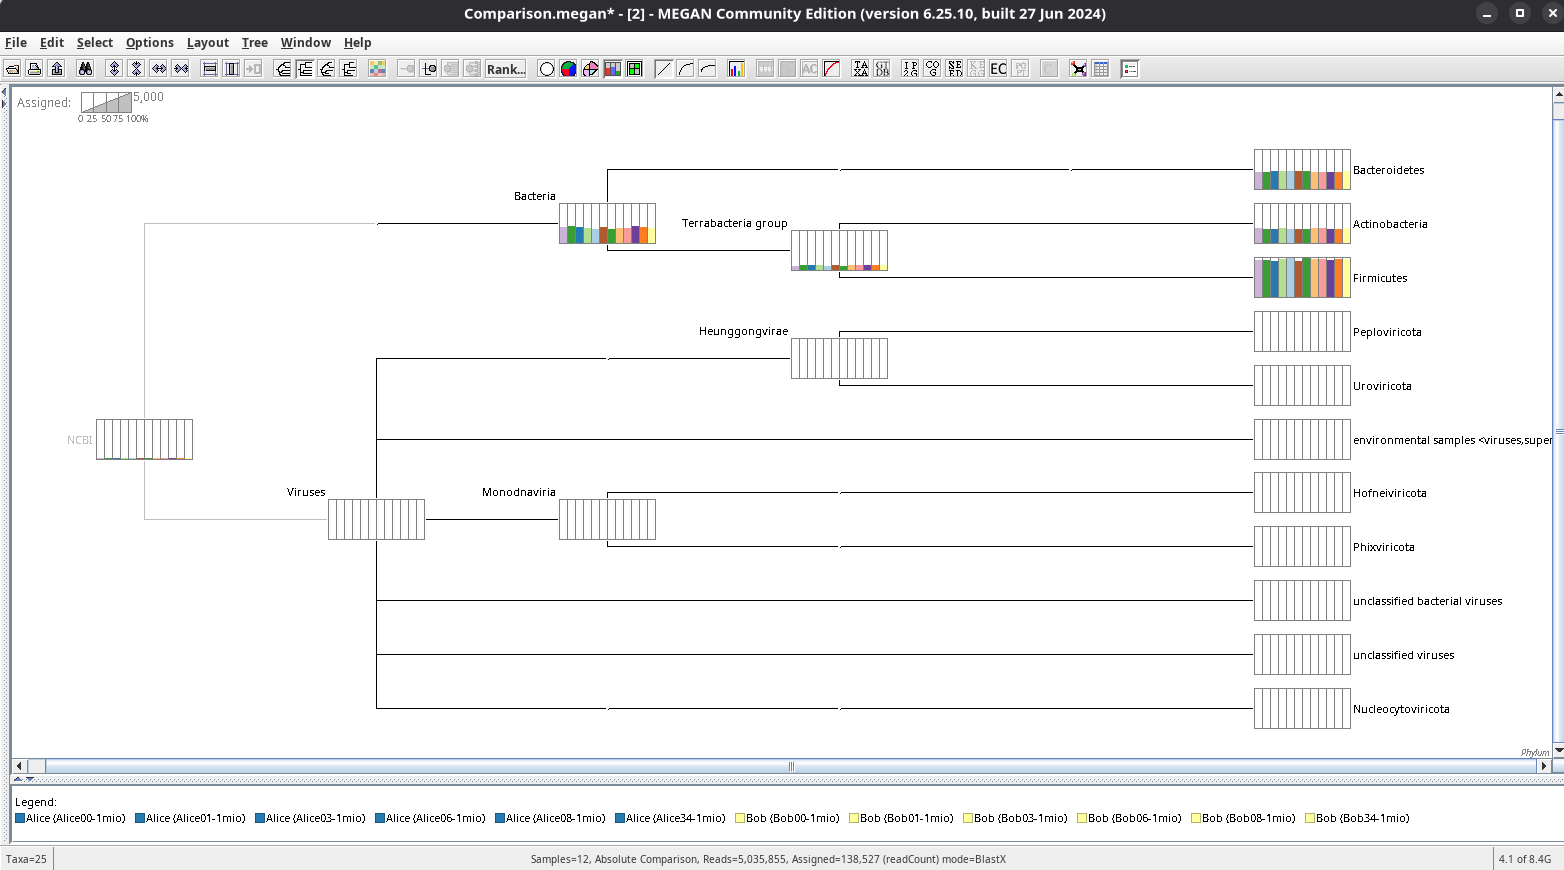
I followed the tutorial from here and therefore used the datasets provided there. I processed all the data with the given commands and opened a comparison of the twelve output files. After importing the metadata.txt I can see three columns in the SamplesViewer. I right-clicked the column ‘Subject’, where the twelve datasets are attributed by the names ‘Alice’ or ‘Bob’. I clicked ‘Select All Values’ and then right-clicked the table head again and chose ‘Use To Color Samples’. In the left view of the SamplesViewer and in the legend of the main window this new color coding is reflected like intended. But in the main window view with the bar plot activated or in a new ‘Taxonomy Chart’ window the color coding is not applied.
The same problem has been described here in this forum for version 6.21.1 and MAC OS.
Hi @Anupam ,
with the provided version of MEGAN 6 from your first link, I have no problems. So you are most probably right with the assumption, that the problem lies within the conda repository. Anyway, I use LINUX, not MacOS.
Thanks for your answer!