Hi,
I am further experimenting with MEGAN Ultimate Edition and found several bugs when using the HeatMap drawer using the commandline.
I run commands in the terminal like that:
/Applications/MEGAN-UE/MEGAN.app/Contents/MacOS/JavaApplicationStub -g -E < ./megan-cmds.txt
Version   MEGAN Ultimate Edition (version 6.24.11, built 1 Dec 2022)
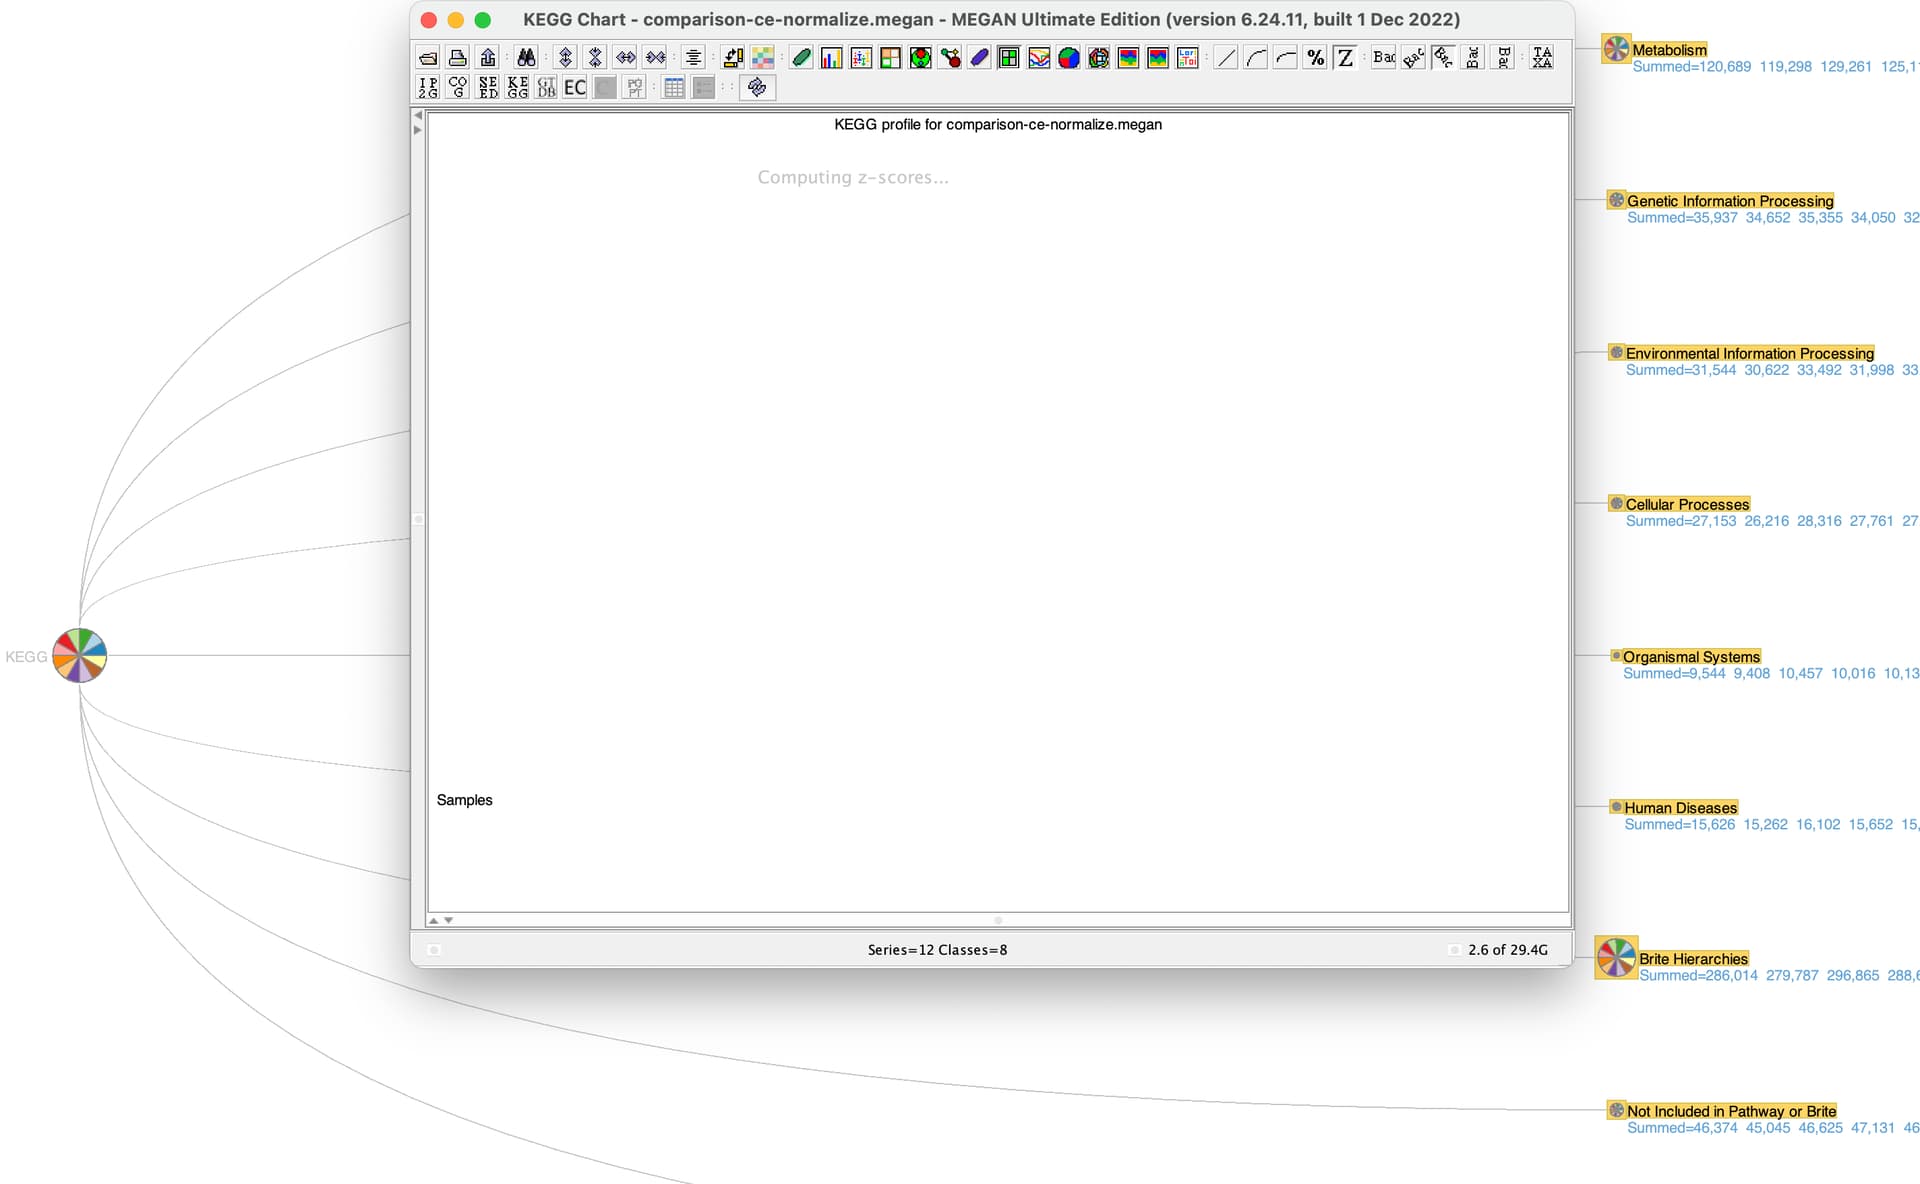
(1) HeatMap view stuck with “Computing z-scores…”
If I just use these commands to open the HeatMap from the KEGG viewer, I just get a blank view with the text “Computing z-scores…”.
new document;
open file='/Users/bernhard/Documents/comparison-ce-normalize.megan' readOnly=true;

open viewer=KEGG;
set context=KEGG; update;

show chart drawer=HeatMap data='KEGG';
set context=KEGGChart;
I want to open the HeatMap view. A workaround until this bug is fixed I found myself is to add a line for opening the BarChart view beforehand show chart drawer=BarChart data='KEGG';). Workaround to show HeatMap:
new document;
open file='/Users/bernhard/Documents/comparison-ce-normalize.megan' readOnly=true;

open viewer=KEGG;
set context=KEGG; update;

show chart drawer=BarChart data='KEGG';
set context=KEGGChart;
show chart drawer=HeatMap data='KEGG';
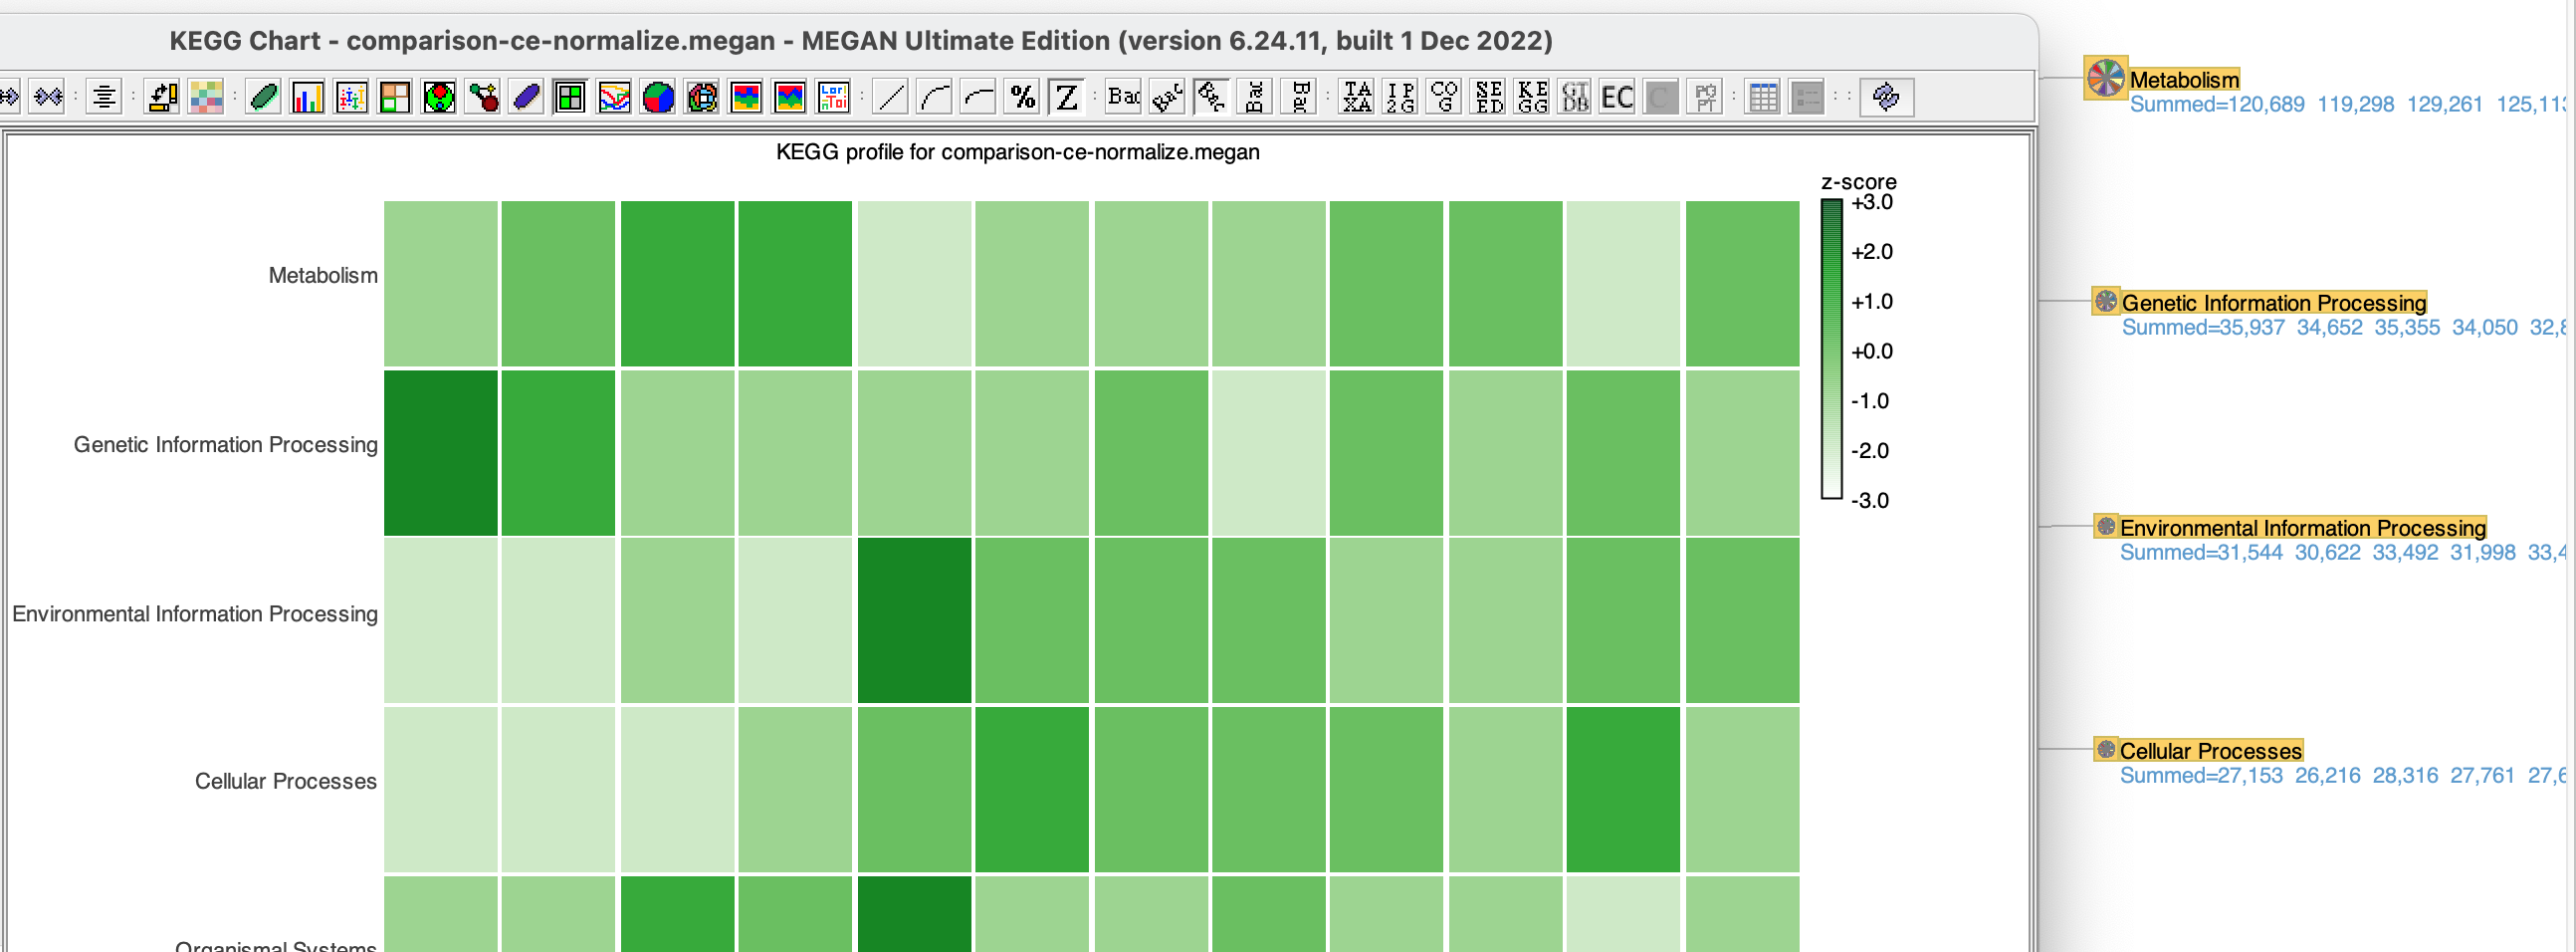
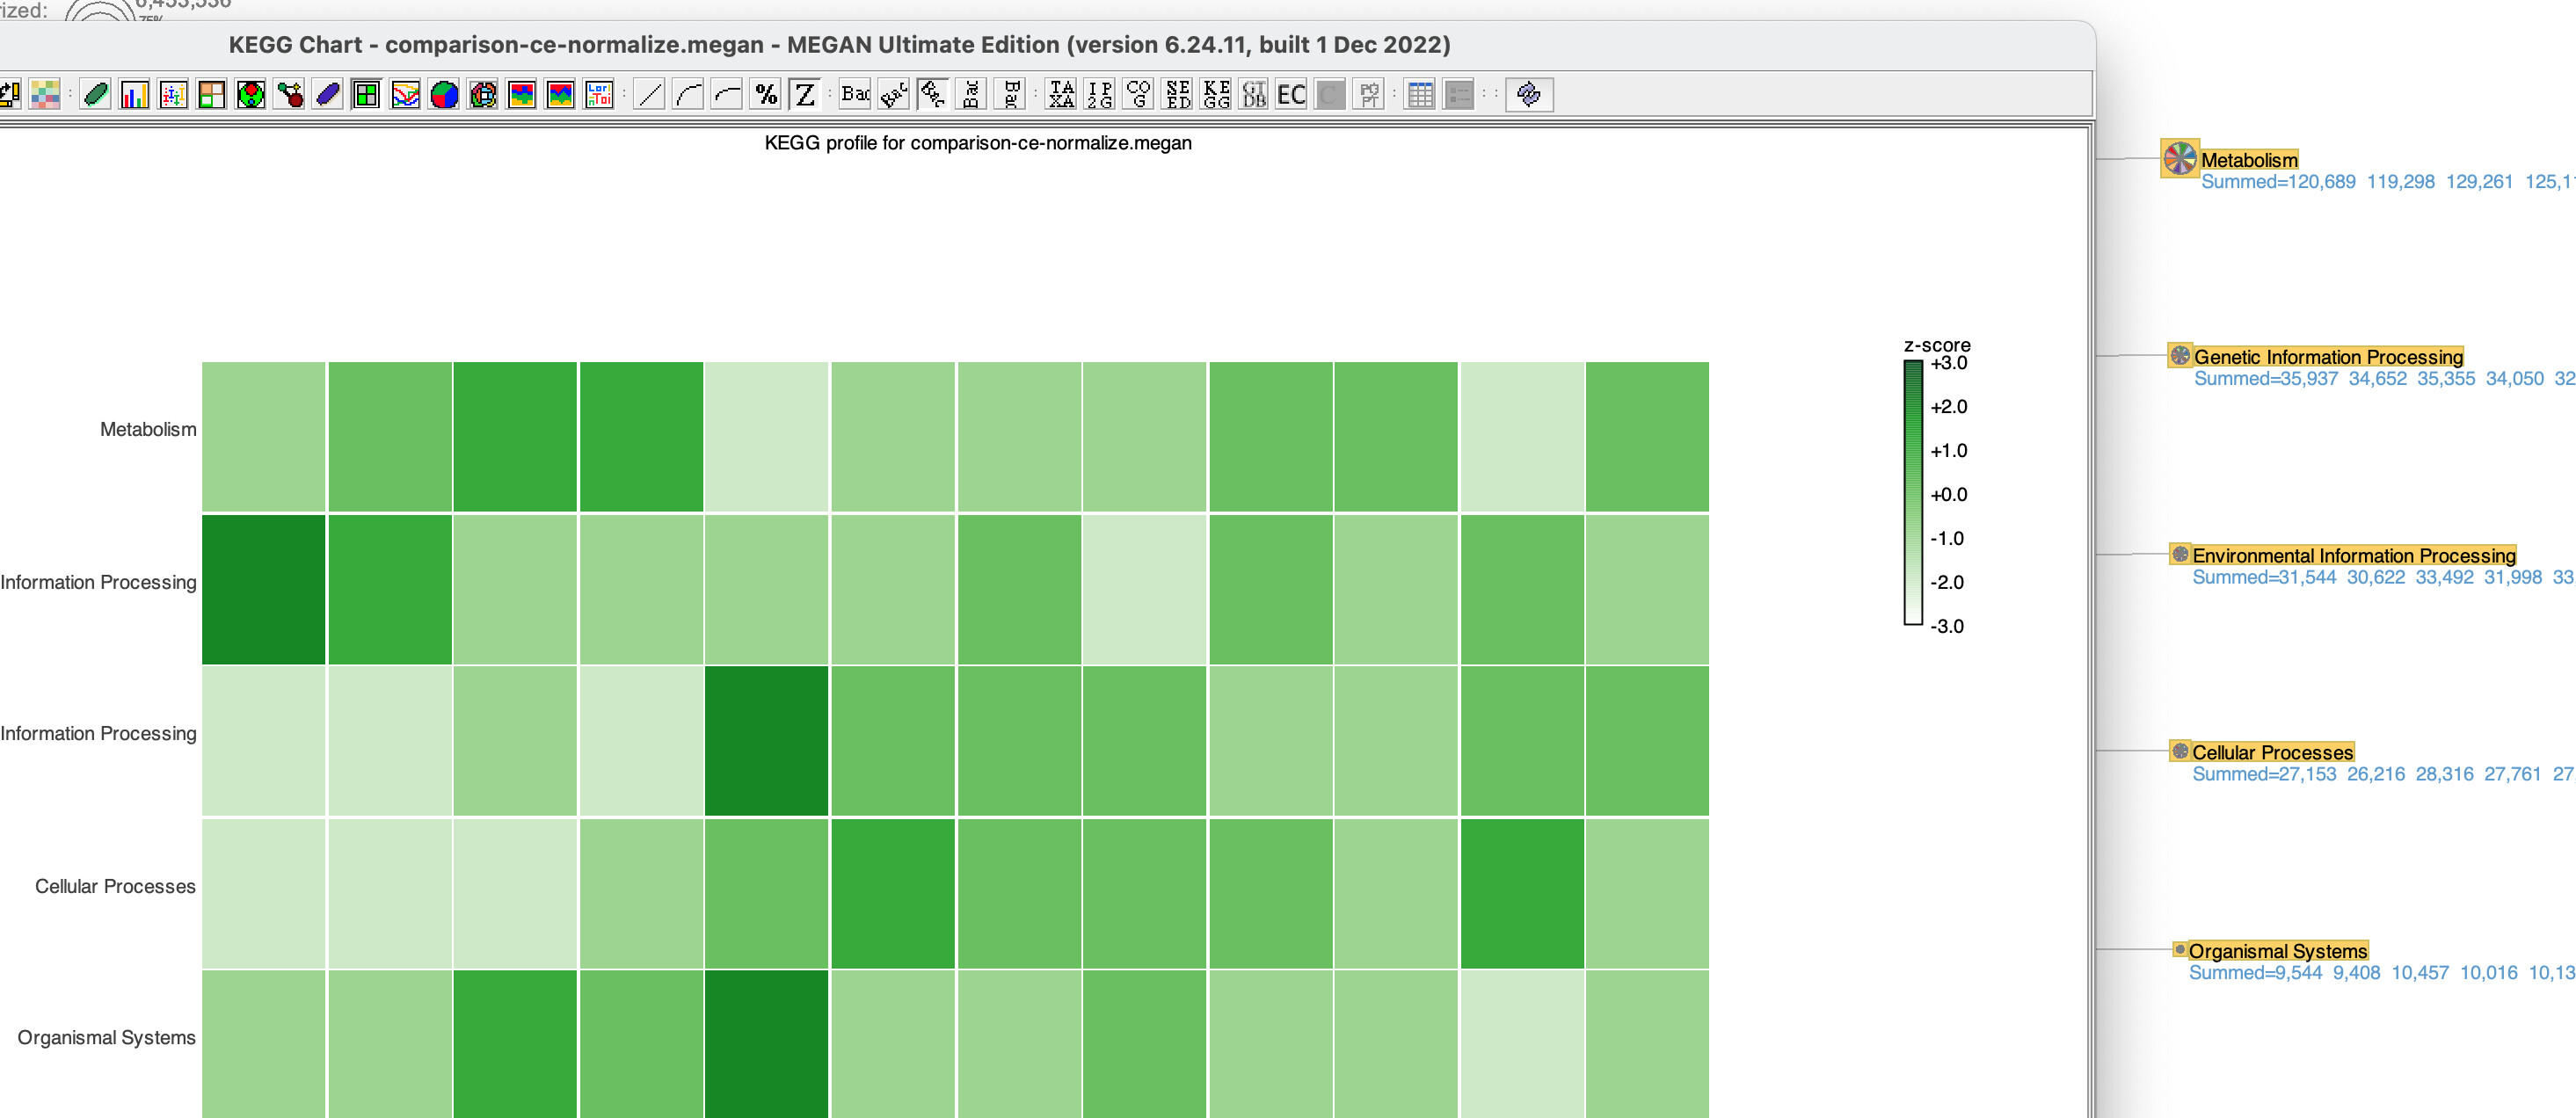
(2) Cluster series and Cluster classes does not work
I want to cluster the series and classes in the HeatMap viewer after setting the chart scale to zscore.
But, when running the commandline commands for that, I just get a blank space around the heatmap, where you would expect the clustering dendrogram.
I have already tried to open the file without the commandline and tried the same steps for adding clustering, and I was successful with the non-commandline mode - the dendrogram was shown. Hence, I suspect there is a bug when clustering in commandline mode, or I am using the commands not correctly.
Here are the commands I tried to use for clustering with no success:
new document;
open file='/Users/bernhard/Documents/comparison-ce-normalize.megan' readOnly=true;

open viewer=KEGG;
set context=KEGG; update;

show chart drawer=BarChart data='KEGG';
set context=KEGGChart;
show chart drawer=HeatMap data='KEGG';
set chartScale=zscore;
cluster what=series state=true;
cluster what=classes state=true;
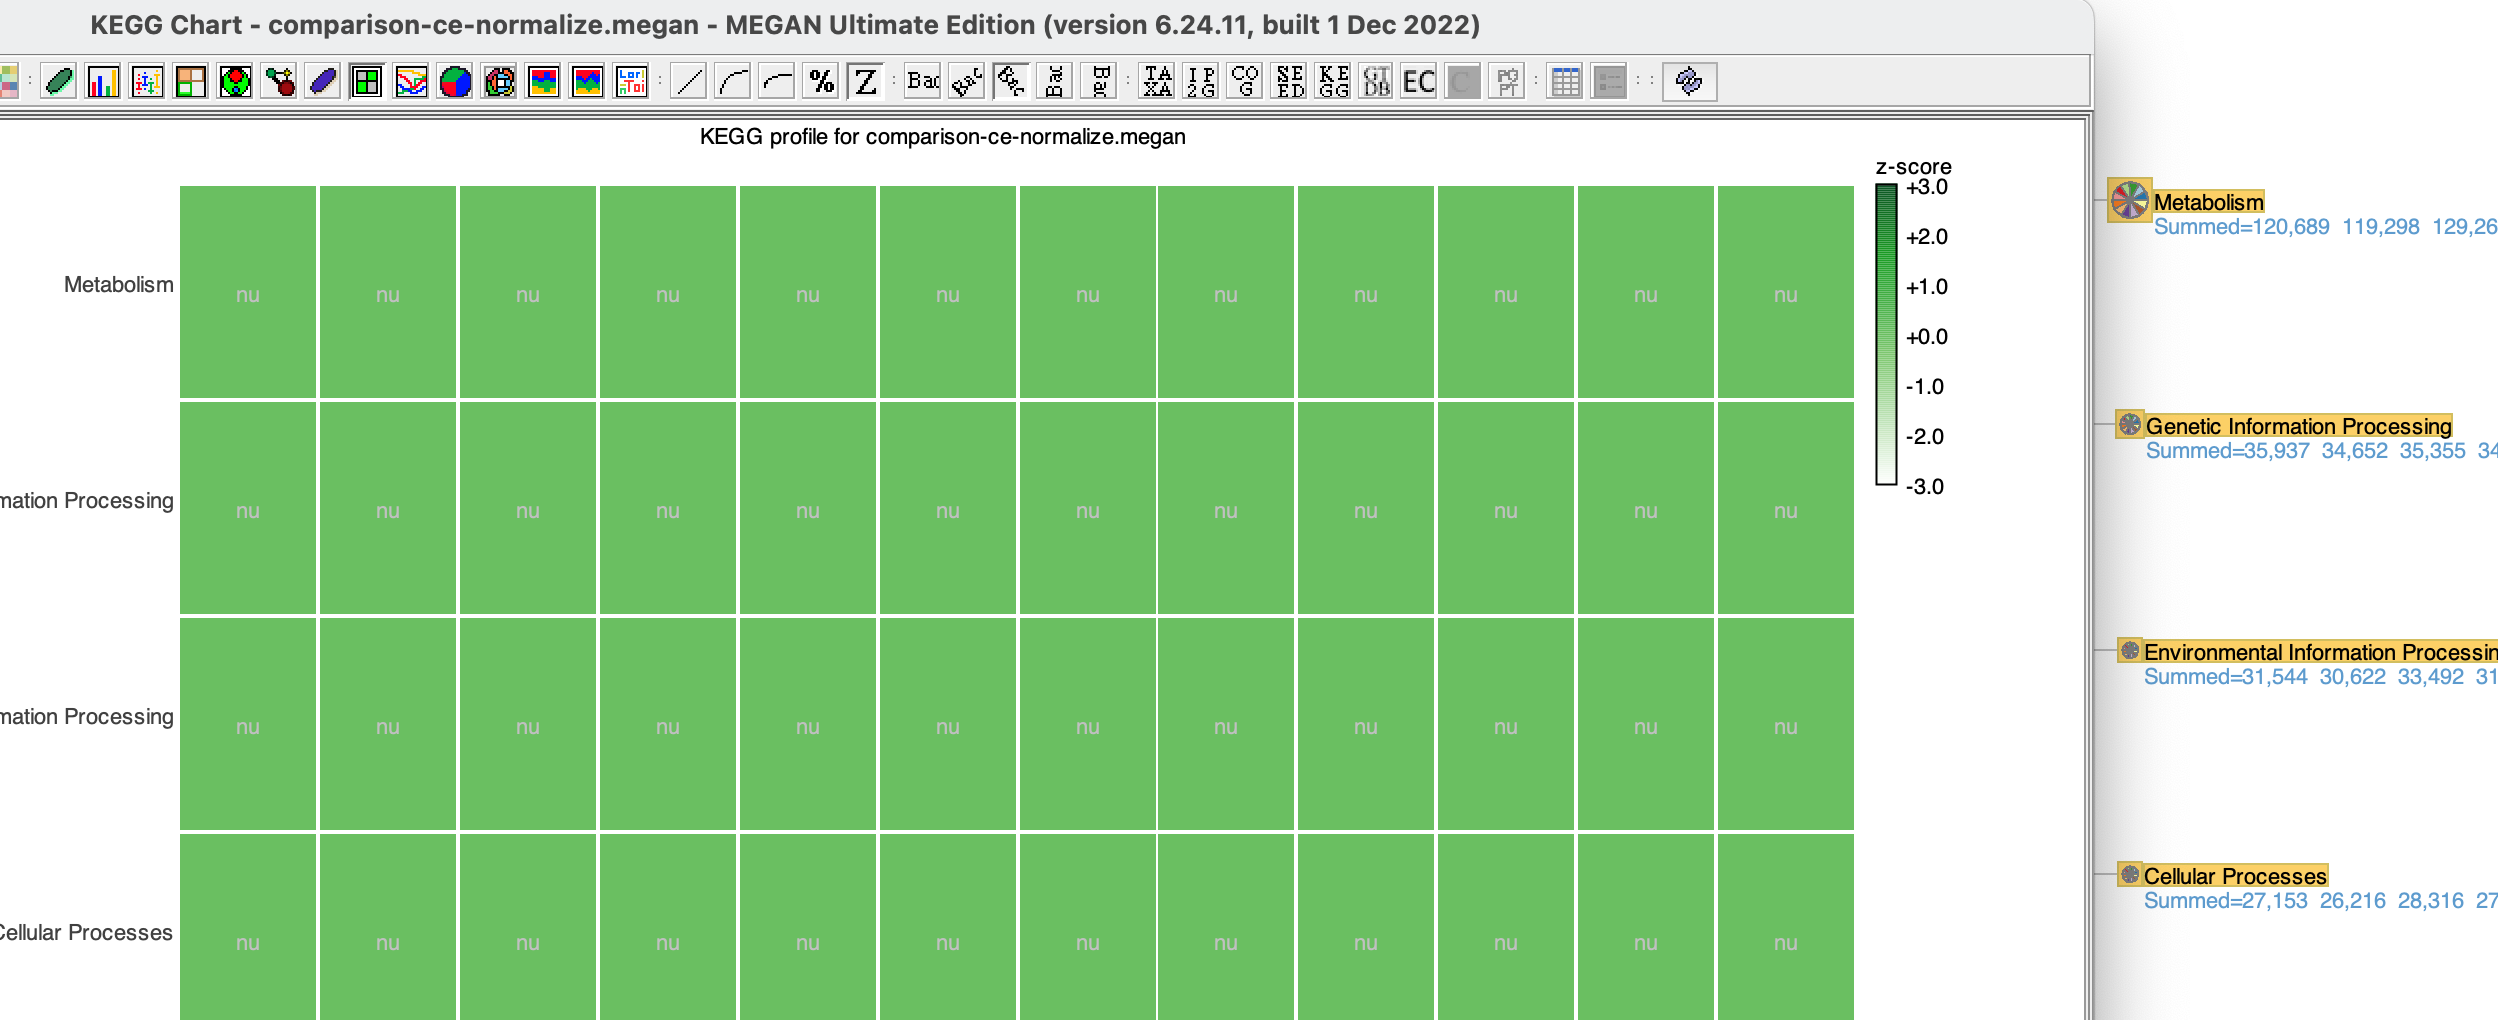
(3) Values are “nu” when using “sync;” command (Sync view of data)
If you use the “sync;” command when using the KEGGChart and you are showing values in the Heatmap, then the values turn to “nu”. So, no more values are shown in the heatmap.
I do not need to use sync right now. This error does not seem to occur in the non-commandline mode though.
Nevertheless, this is something that is unexpected.
new document;
open file='/Users/bernhard/Documents/comparison-ce-normalize.megan' readOnly=true;

open viewer=KEGG;
set context=KEGG; update;

show chart drawer=BarChart data='KEGG';
set context=KEGGChart;
show chart drawer=HeatMap data='KEGG';
set chartScale=zscore;
sync;
I do not see any exceptions or errors in the message window when running these commands.
Thanks for your help. Best regards, Bernhard.